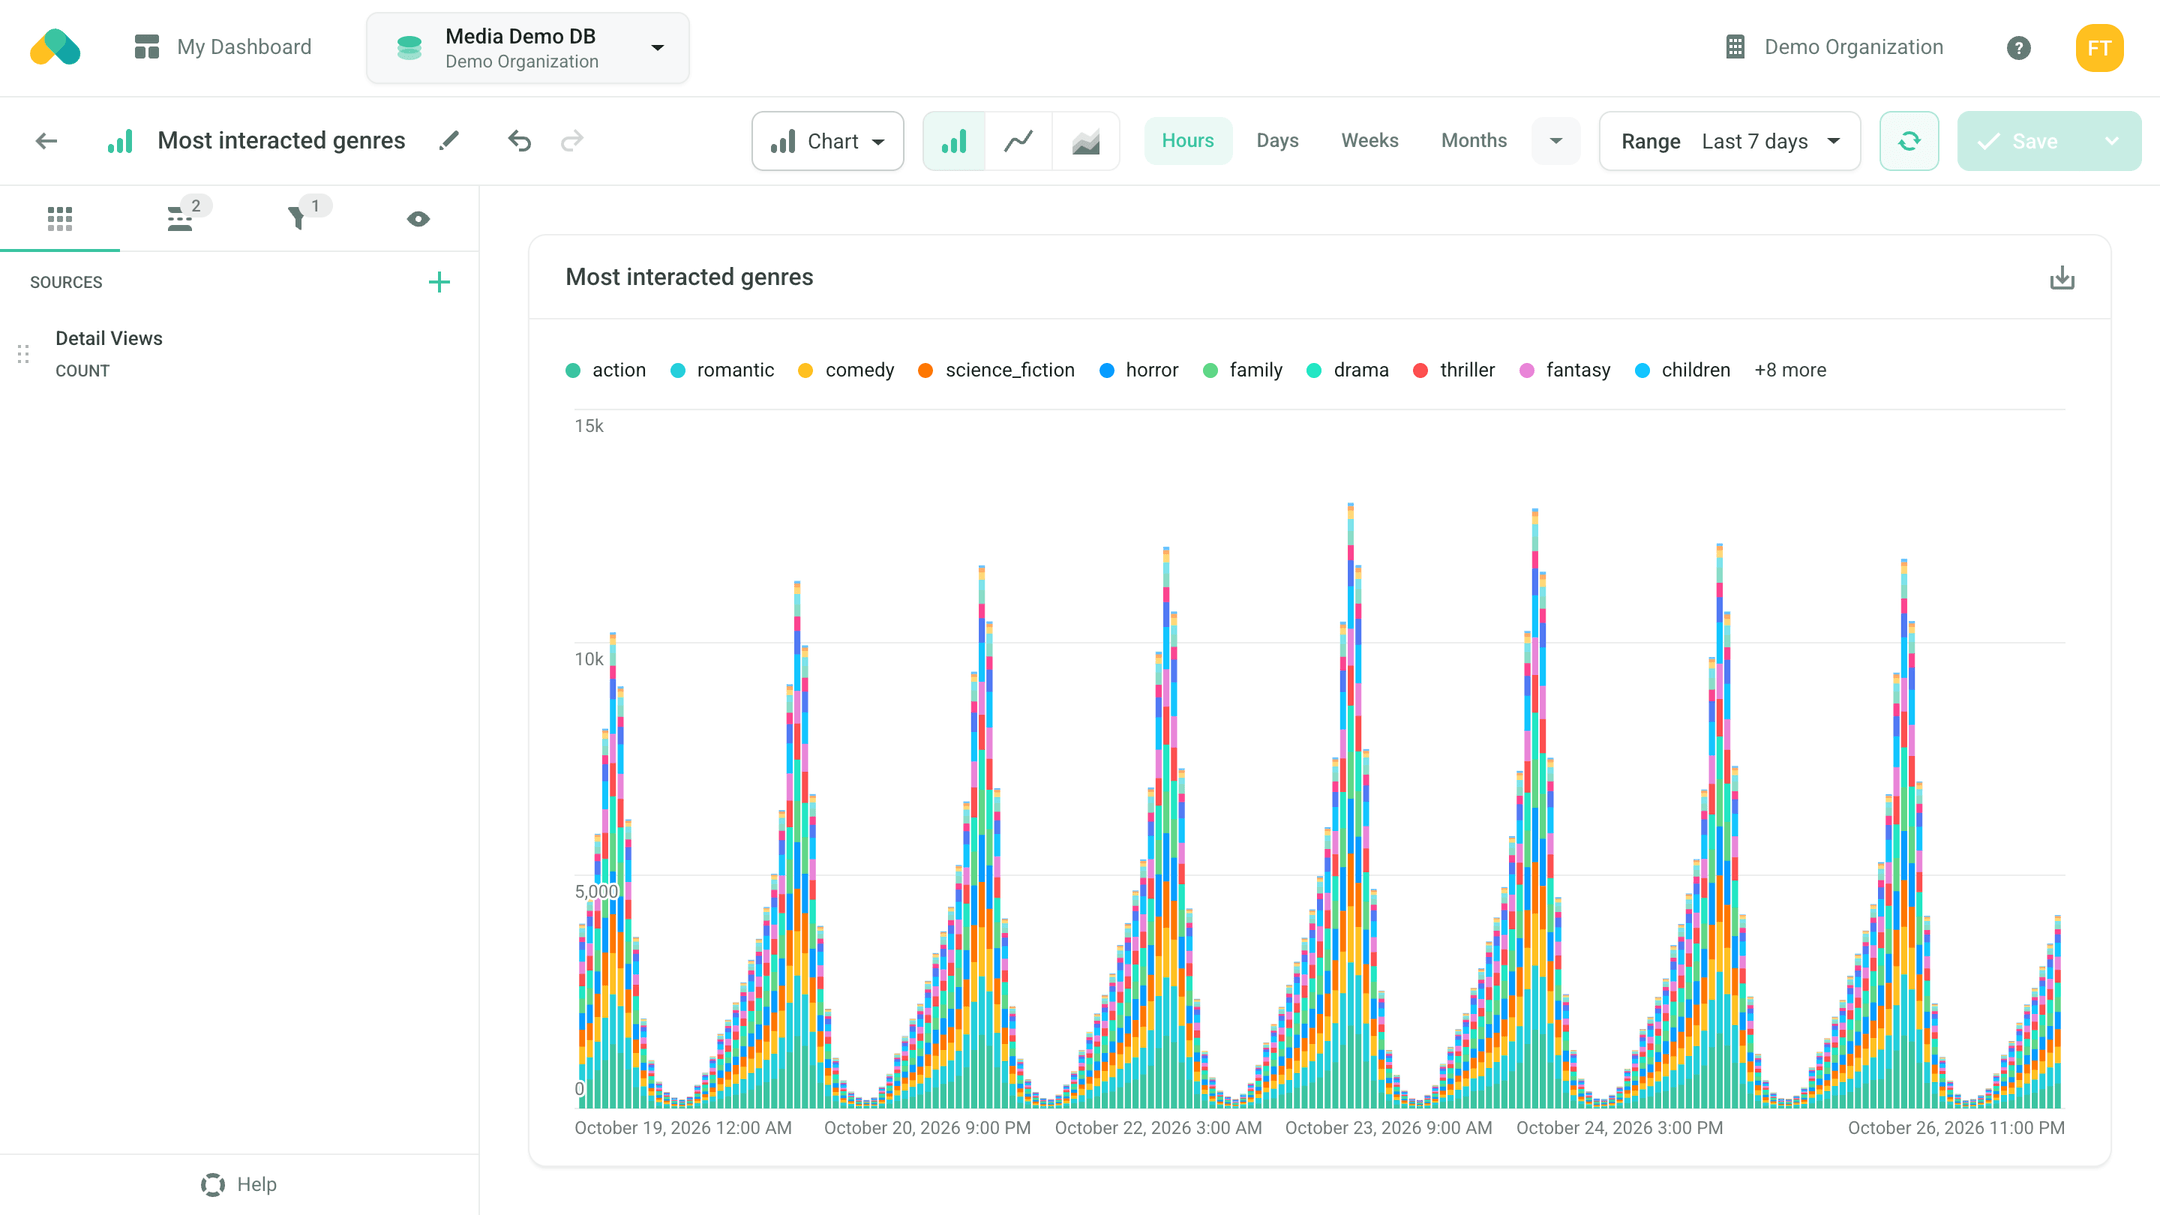

Real-time Data
Access data updated in near real time to quickly assess the impact of changes to your Scenarios and their settings.
Unlock the power of data with Real-Time Analytics & Insights. The Insights section within the Admin UI provides a range of predefined and fully customizable reports, allowing you to monitor how users engage with recommendations and your platform. This transparency enables close tracking of the recommender’s performance, user engagement metrics, and organic interactions.
Experience the benefits of data updated in near real-time, so you can swiftly assess the impact of any changes made to Scenarios or their settings.
With Real-Time Data, you can:
- See Results Within a Second: new recommendations and interactions are taken into account in less than a second
- Get Instant Feedback: see what every change to a Scenario does right away, instead of waiting for tomorrow’s report
- Watch the Recommender at Work: transparent, close monitoring of its behavior, user engagement details, and organic interactions